Compare & Contrast

Explore and interpret your project data in new and insightful ways. Our Compare & Contrast tools enable you to identify differences between models, surveys, plans, and imagery. By highlighting variations and trends, these insights support informed decision-making and encourage proactive management.

DSM & DTM

Discover the distinct layers of your project environment with Digital Surface Models (DSM) and Digital Terrain Models (DTM). By comparing these two representations, you can gain deeper insights into landscape features, vegetation coverage, and structural elements. This comprehensive perspective enables more effective planning, design, and response to natural and built environments.

Refine Terrain Analysis

Focus on the underlying ground profile to gain a clearer understanding of slopes, depressions, and other surface features. Detailed terrain analysis enables you to anticipate drainage paths, stabilise foundations, and ensure infrastructure is aligned with natural contours.

Surface Feature Insights

Identify and distinguish above-ground features, such as buildings or vegetation. By comparing DSM and DTM, you can isolate and analyse these elements, supporting maintenance planning, structural assessments, and landscape management.

Survey to Survey

Compare successive surveys to detect changes, track progress, and validate work completed. By viewing your site’s evolution over time, you can optimise resources, adjust plans, and ensure your project remains on schedule and within budget.

Change Detection Over Time

Pinpoint where terrain, structures, or materials have shifted between one survey and the next. Detecting changes early helps you act promptly, refining operations, and safeguarding against unforeseen costs.

Progress Verification

Confirm that planned work has been carried out as intended. By comparing surveys, you can measure completed volumes, confirm excavation depths, and validate that milestones are being met without costly delays.

Survey to Plan

Align your real world conditions with your intended outcomes by comparing surveyed data against design plans. This contrast provides a reliable check that engineering specifications, architectural visions, and regulatory standards are being respected.

Design Validation

Confirm that constructed features match their intended positions, sizes, and shapes. Design validation supports quality control, reduces errors, and helps you deliver on commitments made to stakeholders.

Plan Adherence

Monitor how closely your project follows the approved blueprint, identifying deviations and correcting them before they cause schedule overruns or regulatory complications. Ensuring adherence to plans builds trust and maintains transparency throughout the project lifecycle.

Thermal to RGB

Combine thermal imagery with traditional RGB (colour) imagery to gain a richer, more comprehensive understanding of your site. By contrasting heat signatures with visible features, you can detect problems invisible to the naked eye and address them proactively.

Uncover Hidden Anomalies

Spot temperature variations that may indicate equipment faults, energy inefficiencies, or developing structural issues. Thermal data reveals subtle patterns that help you prioritise maintenance and improve overall performance.

Visual Clarity and Context

Enhance your understanding by placing thermal patterns into the familiar context of colour imagery. Seeing heat variations overlaid on standard visuals makes it easier to pinpoint issues, communicate findings, and take effective action.

Want To Know More?

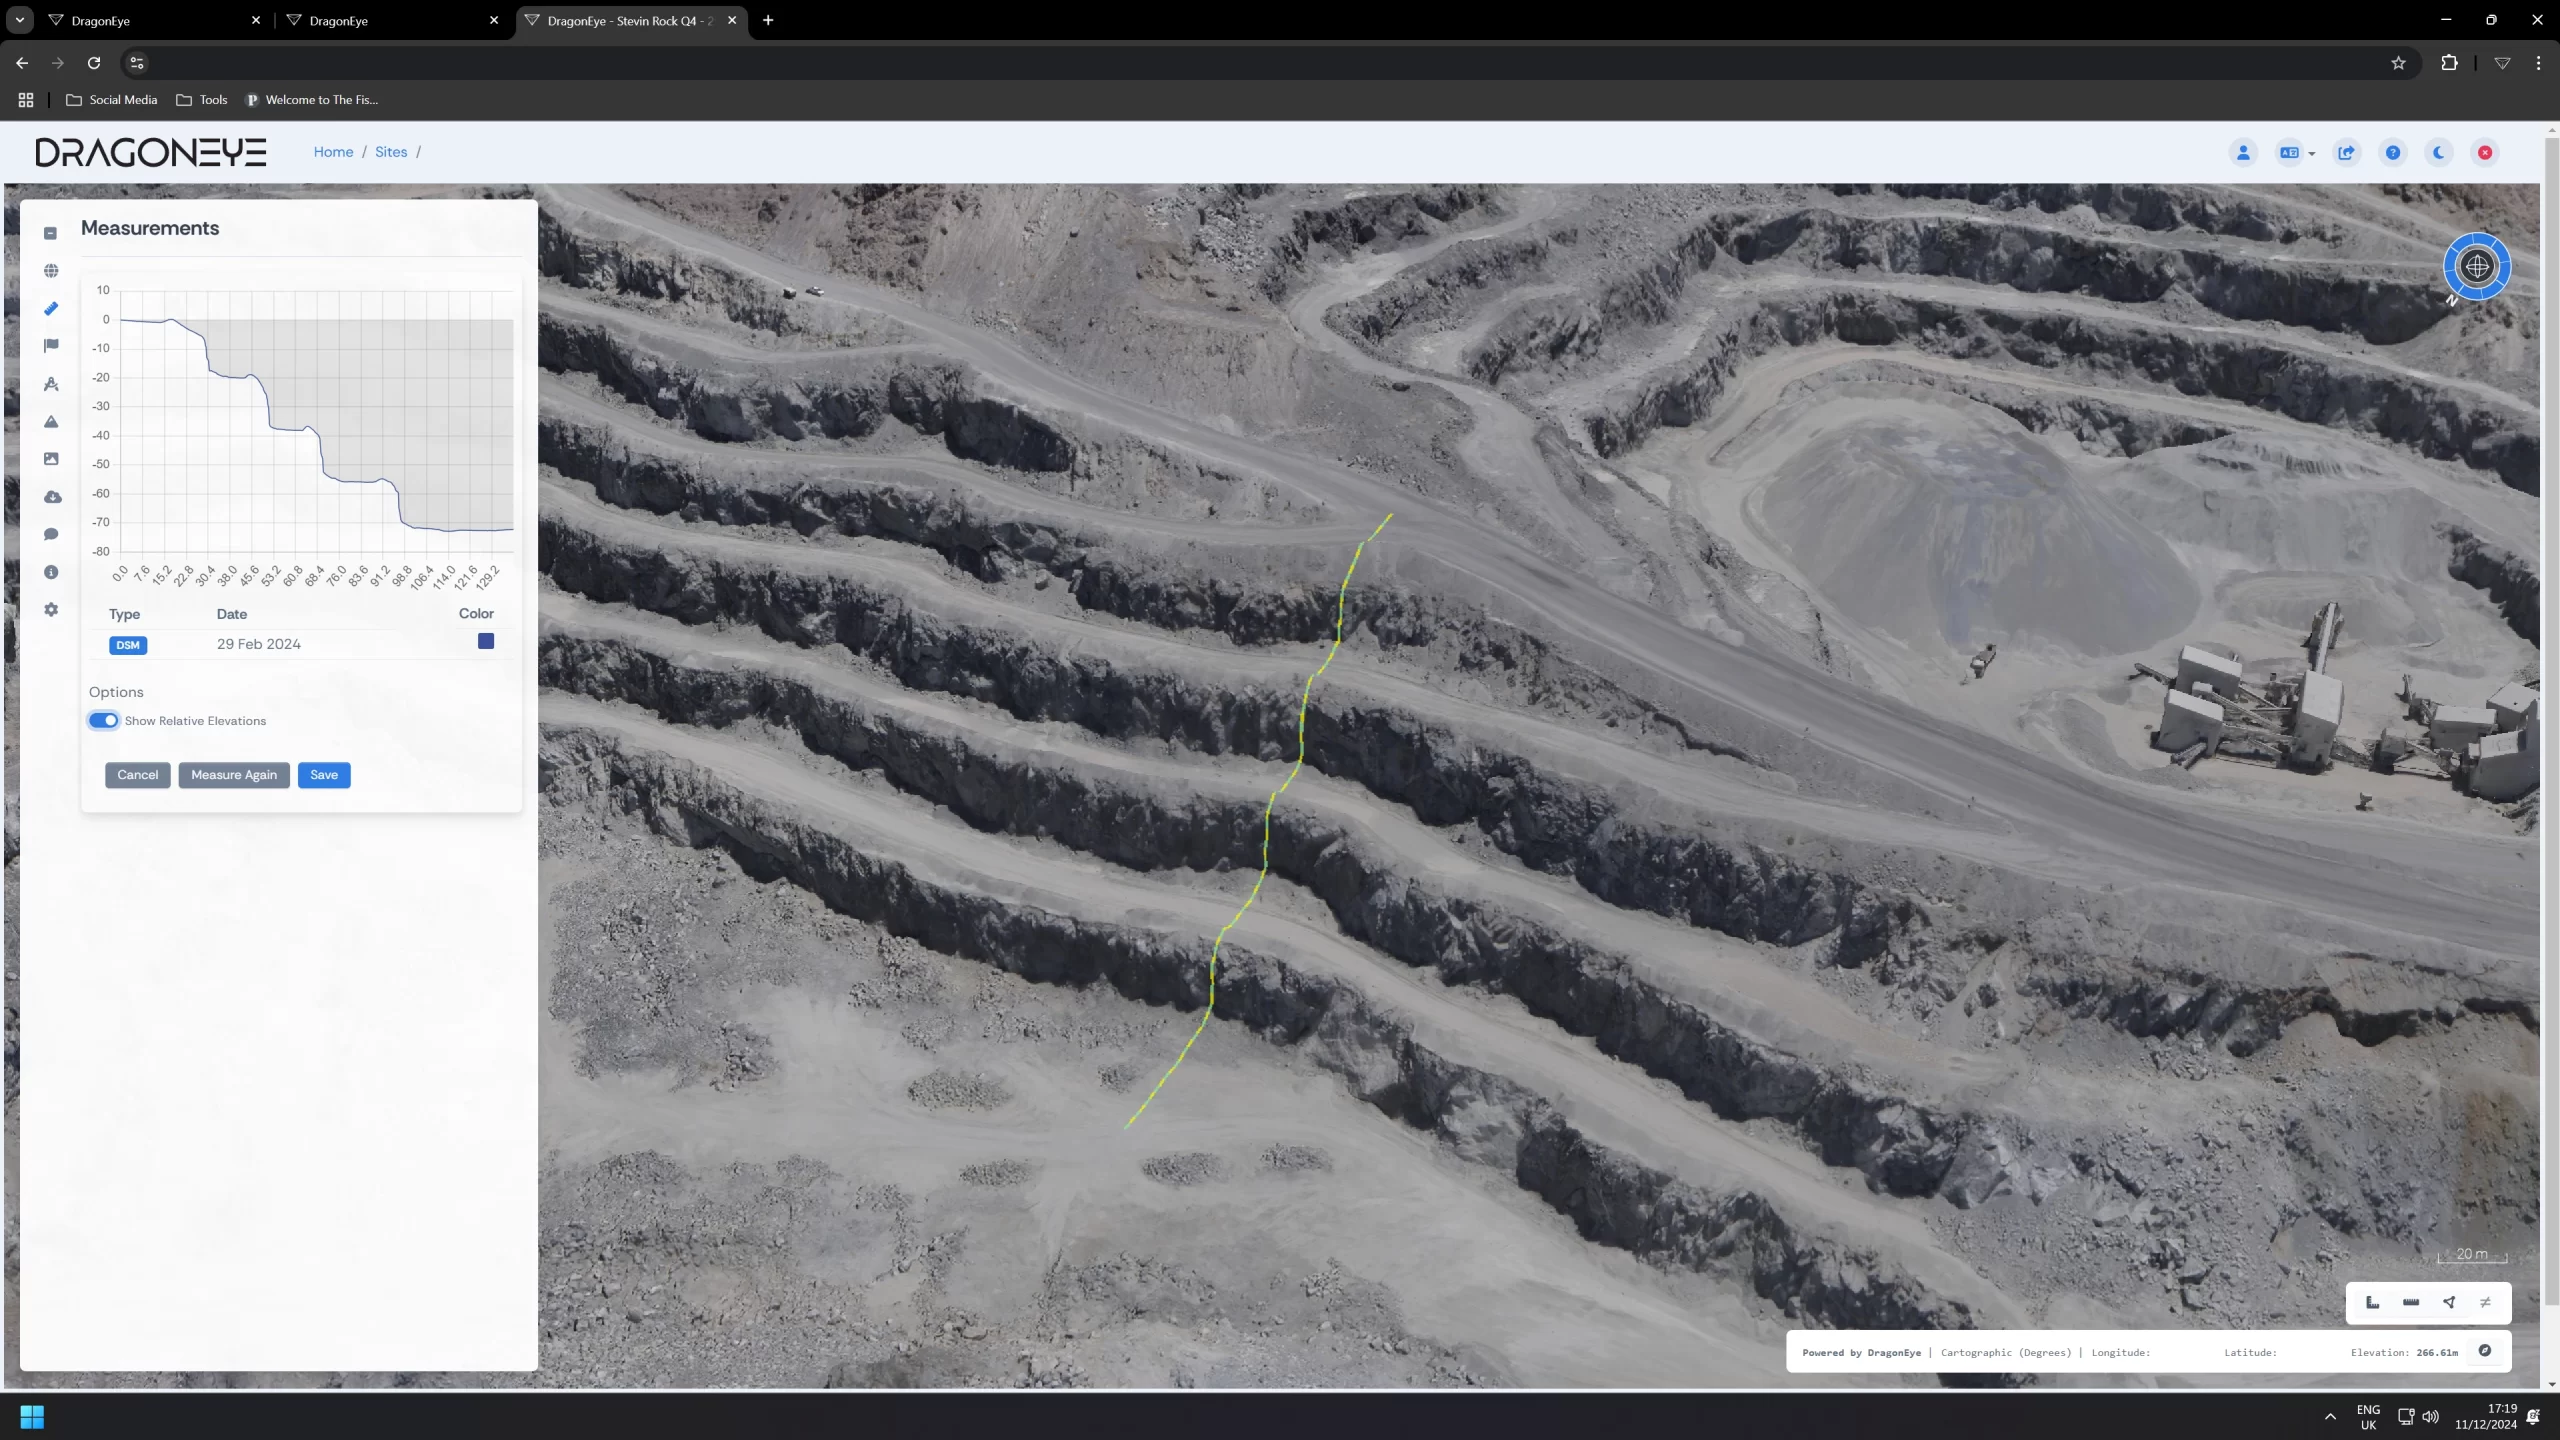
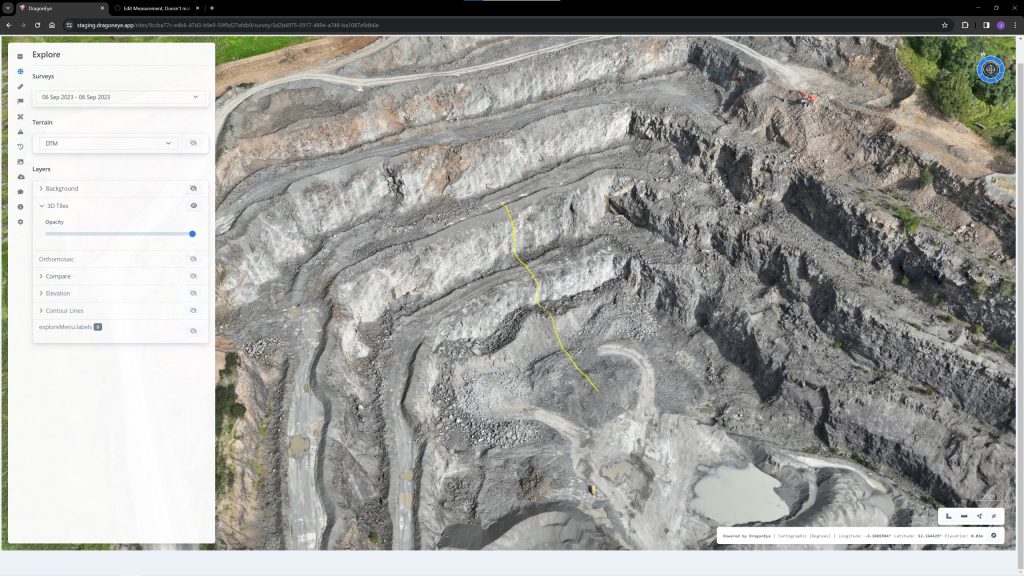
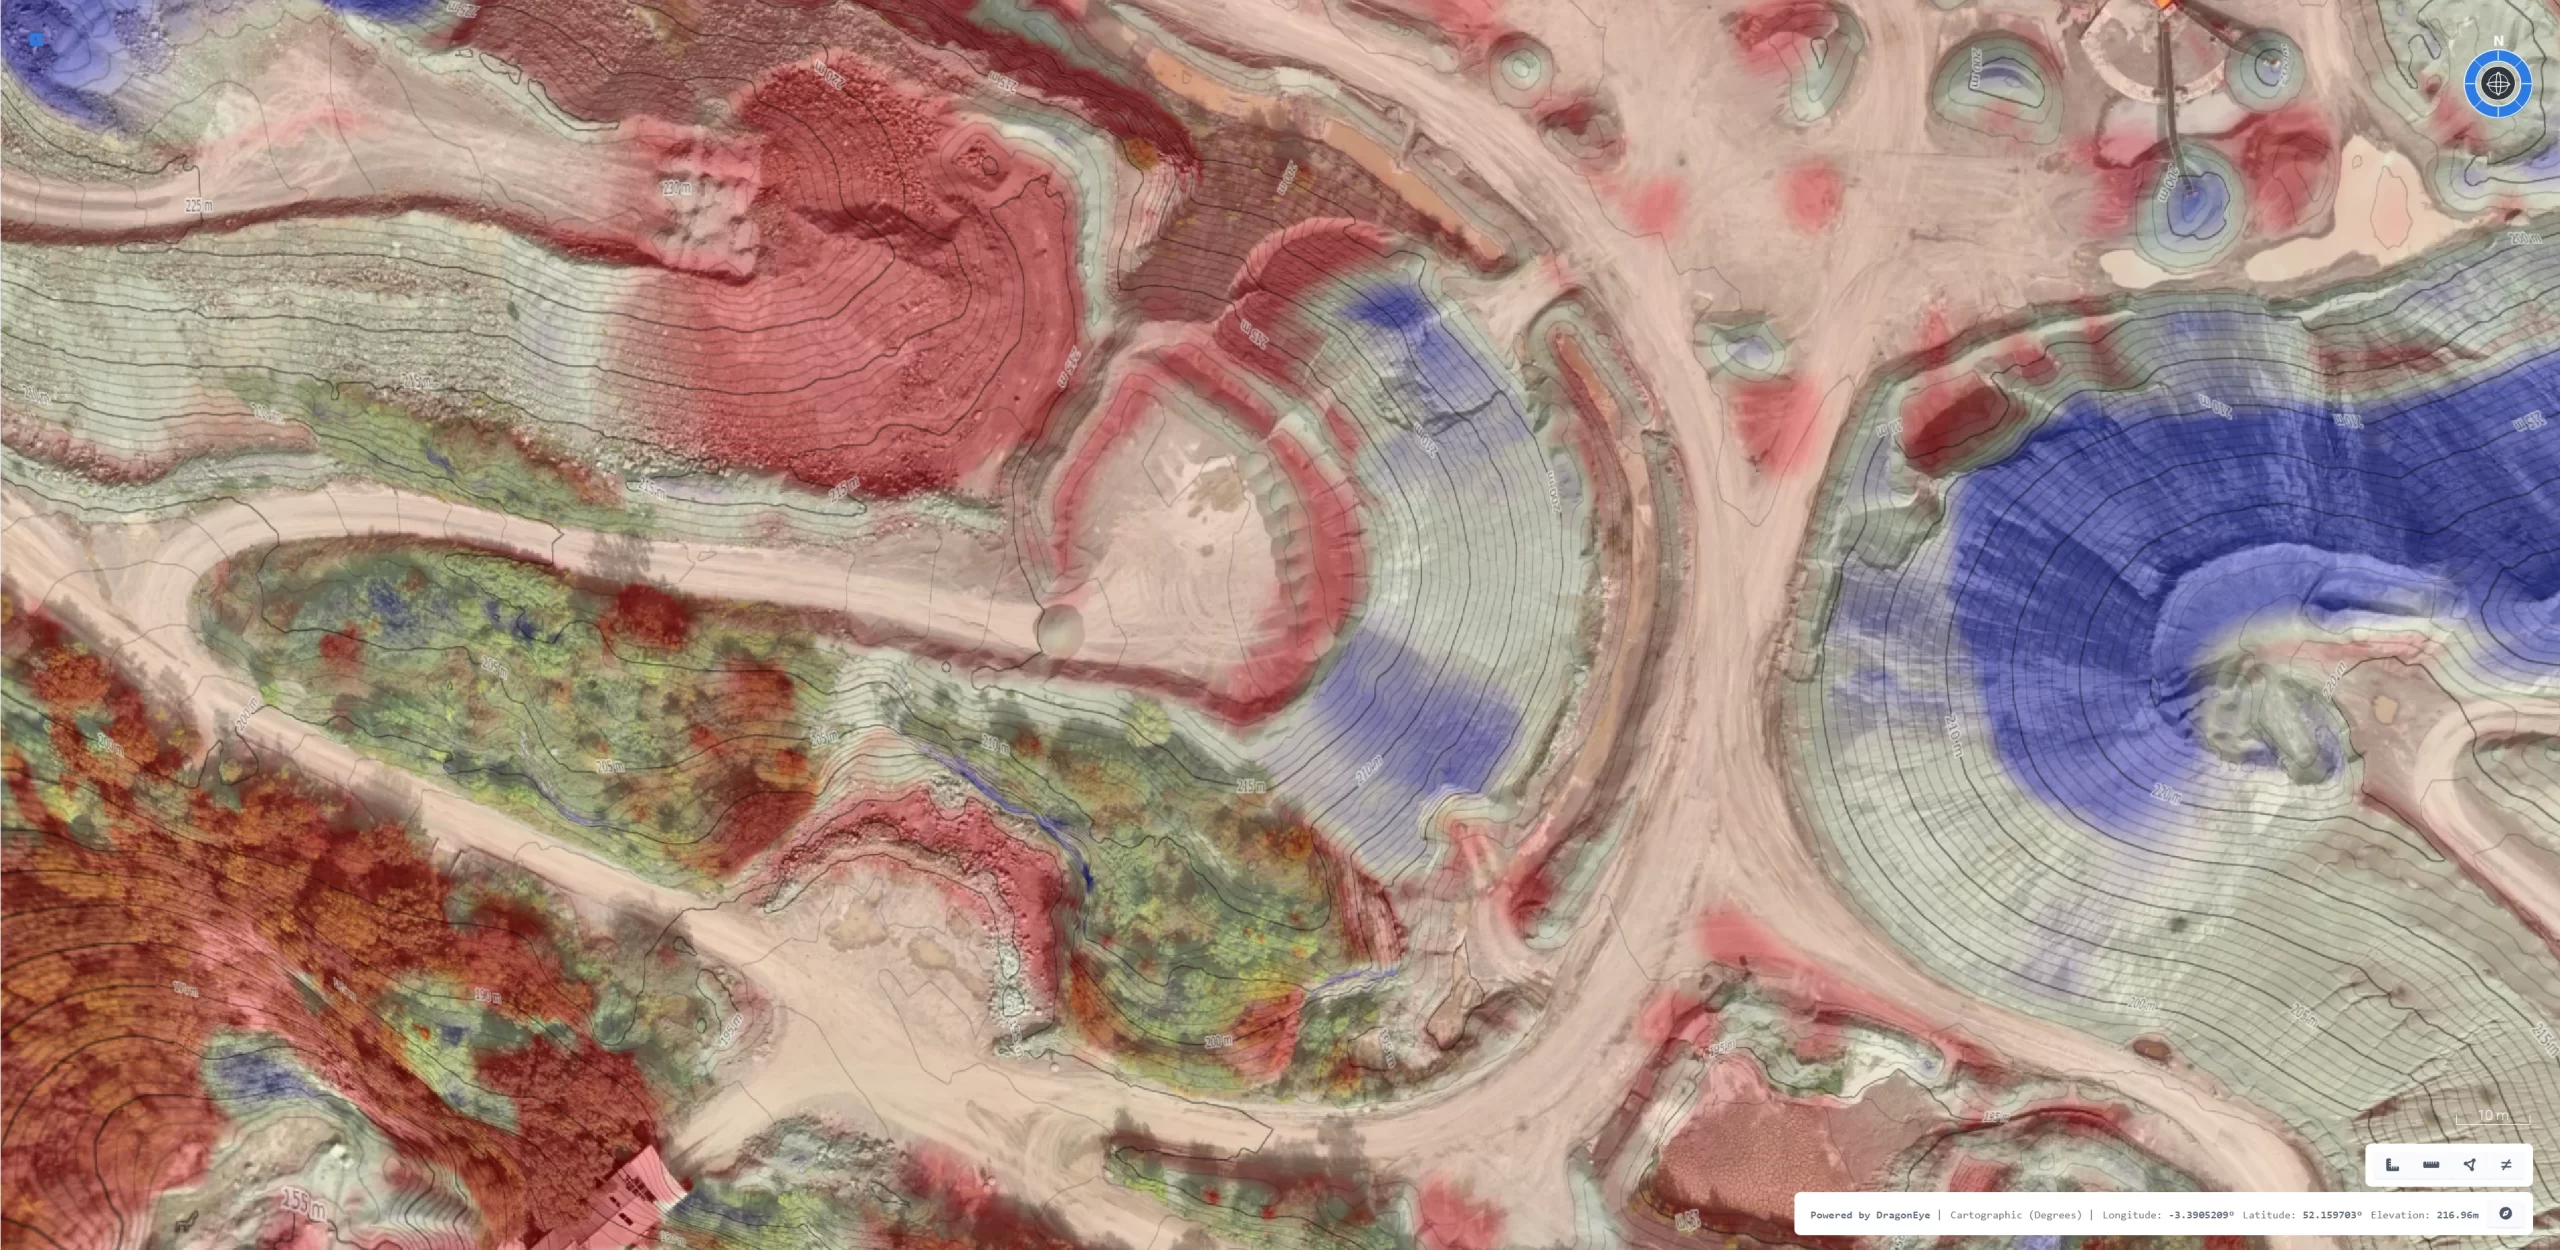
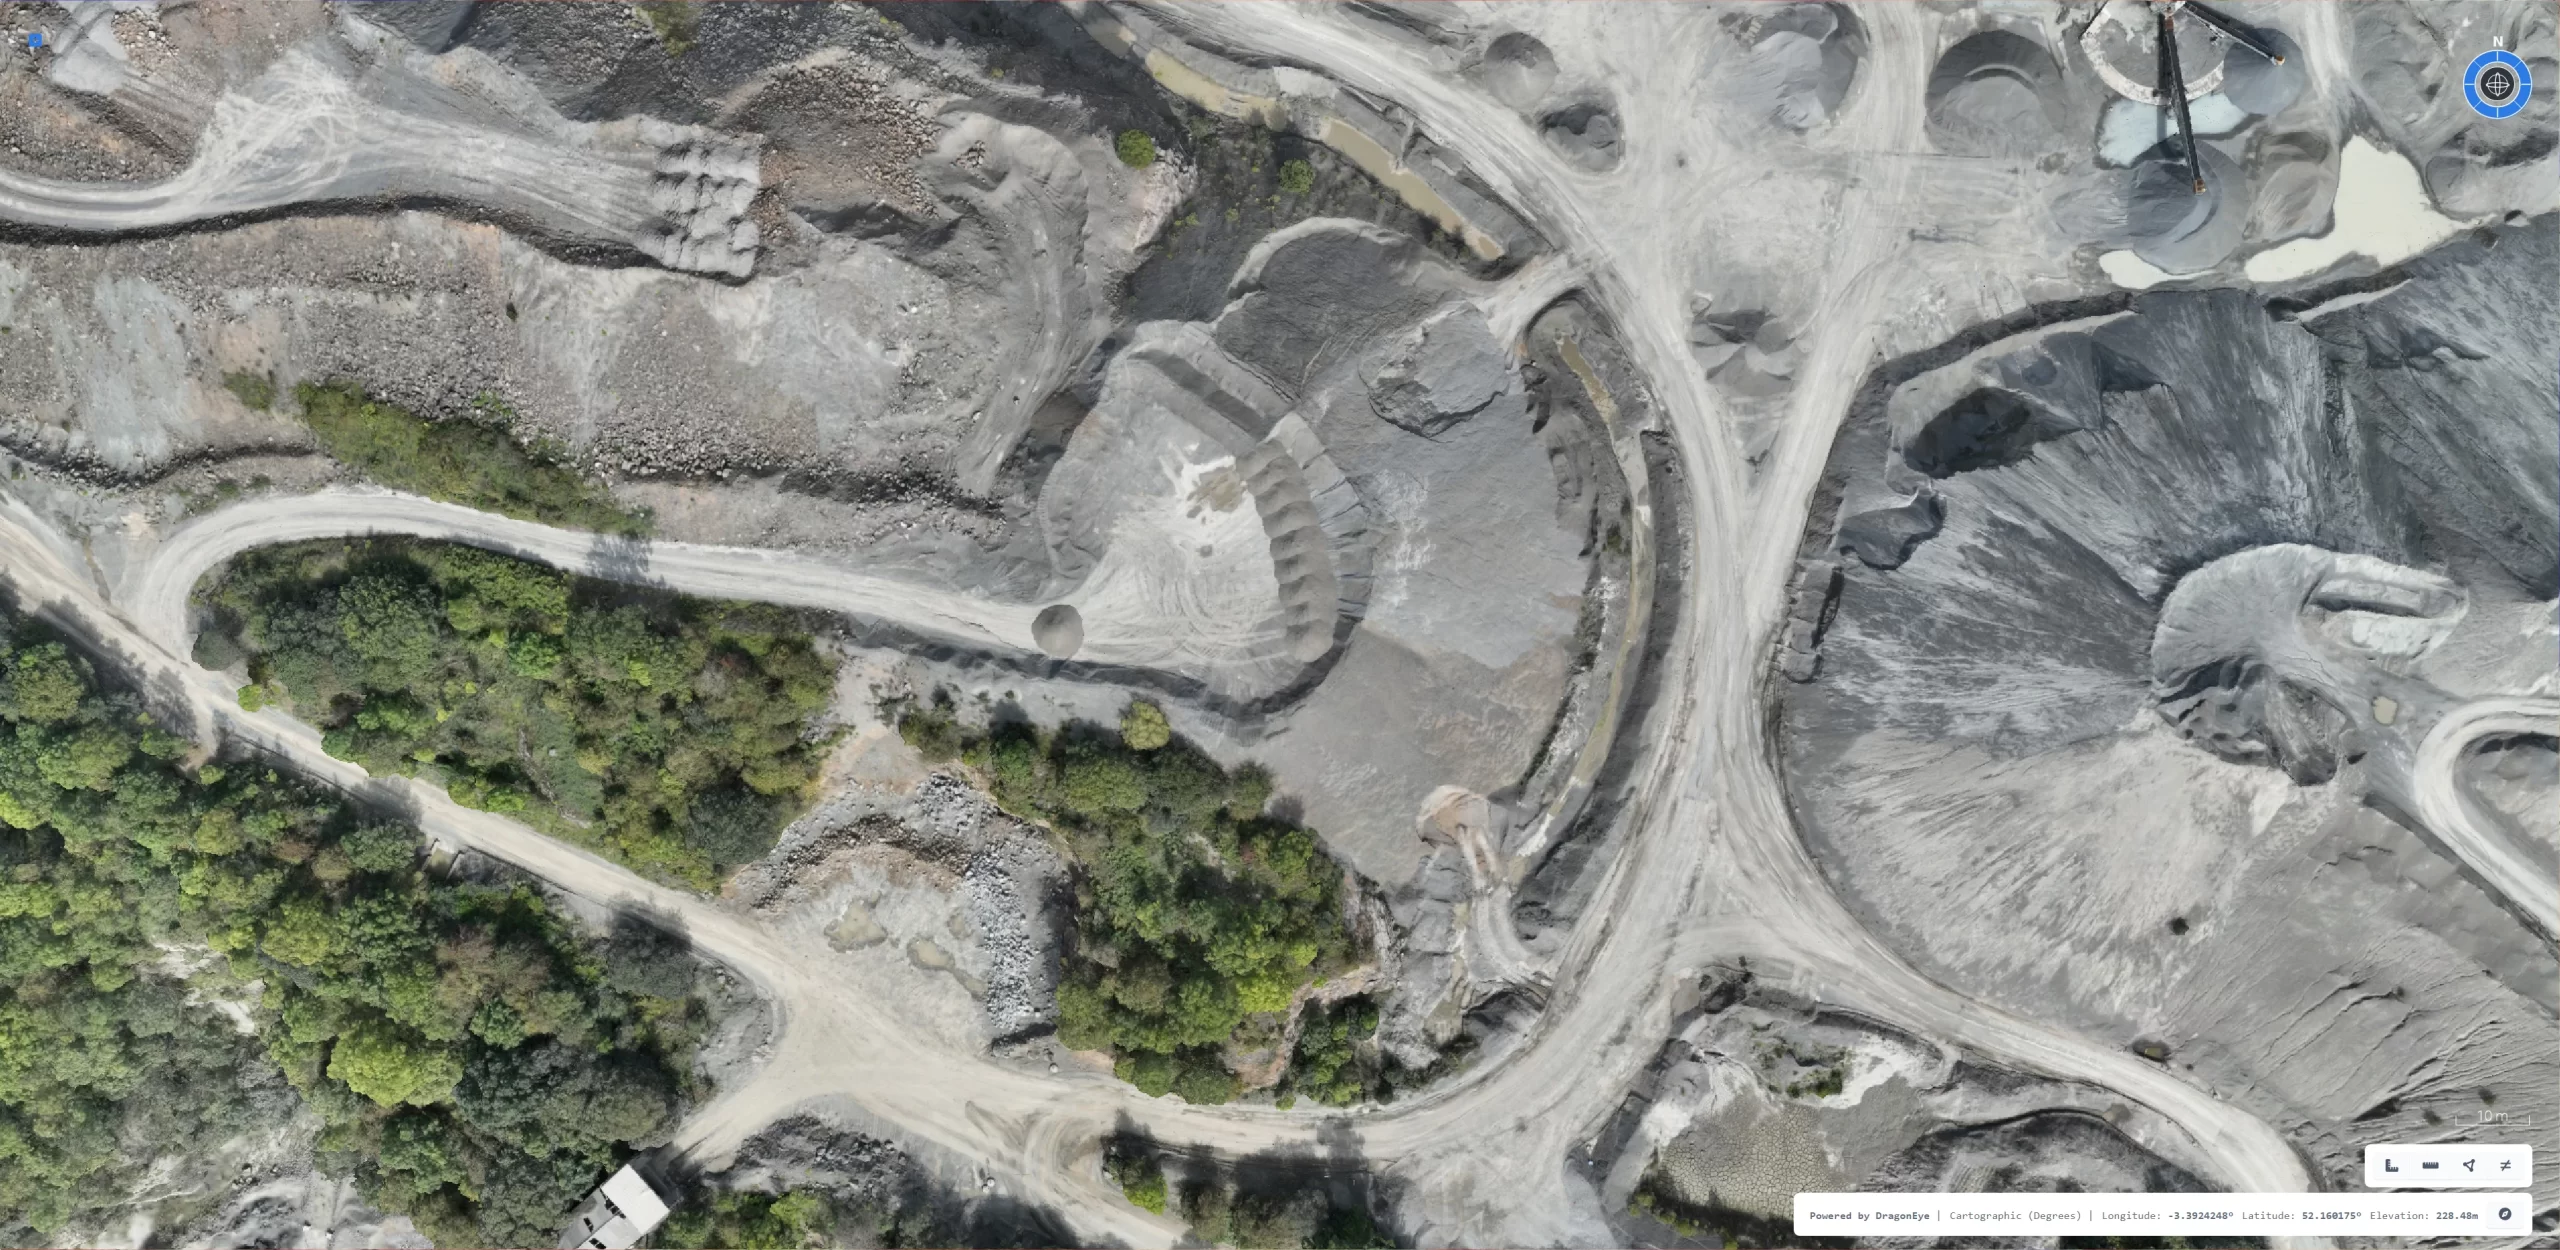
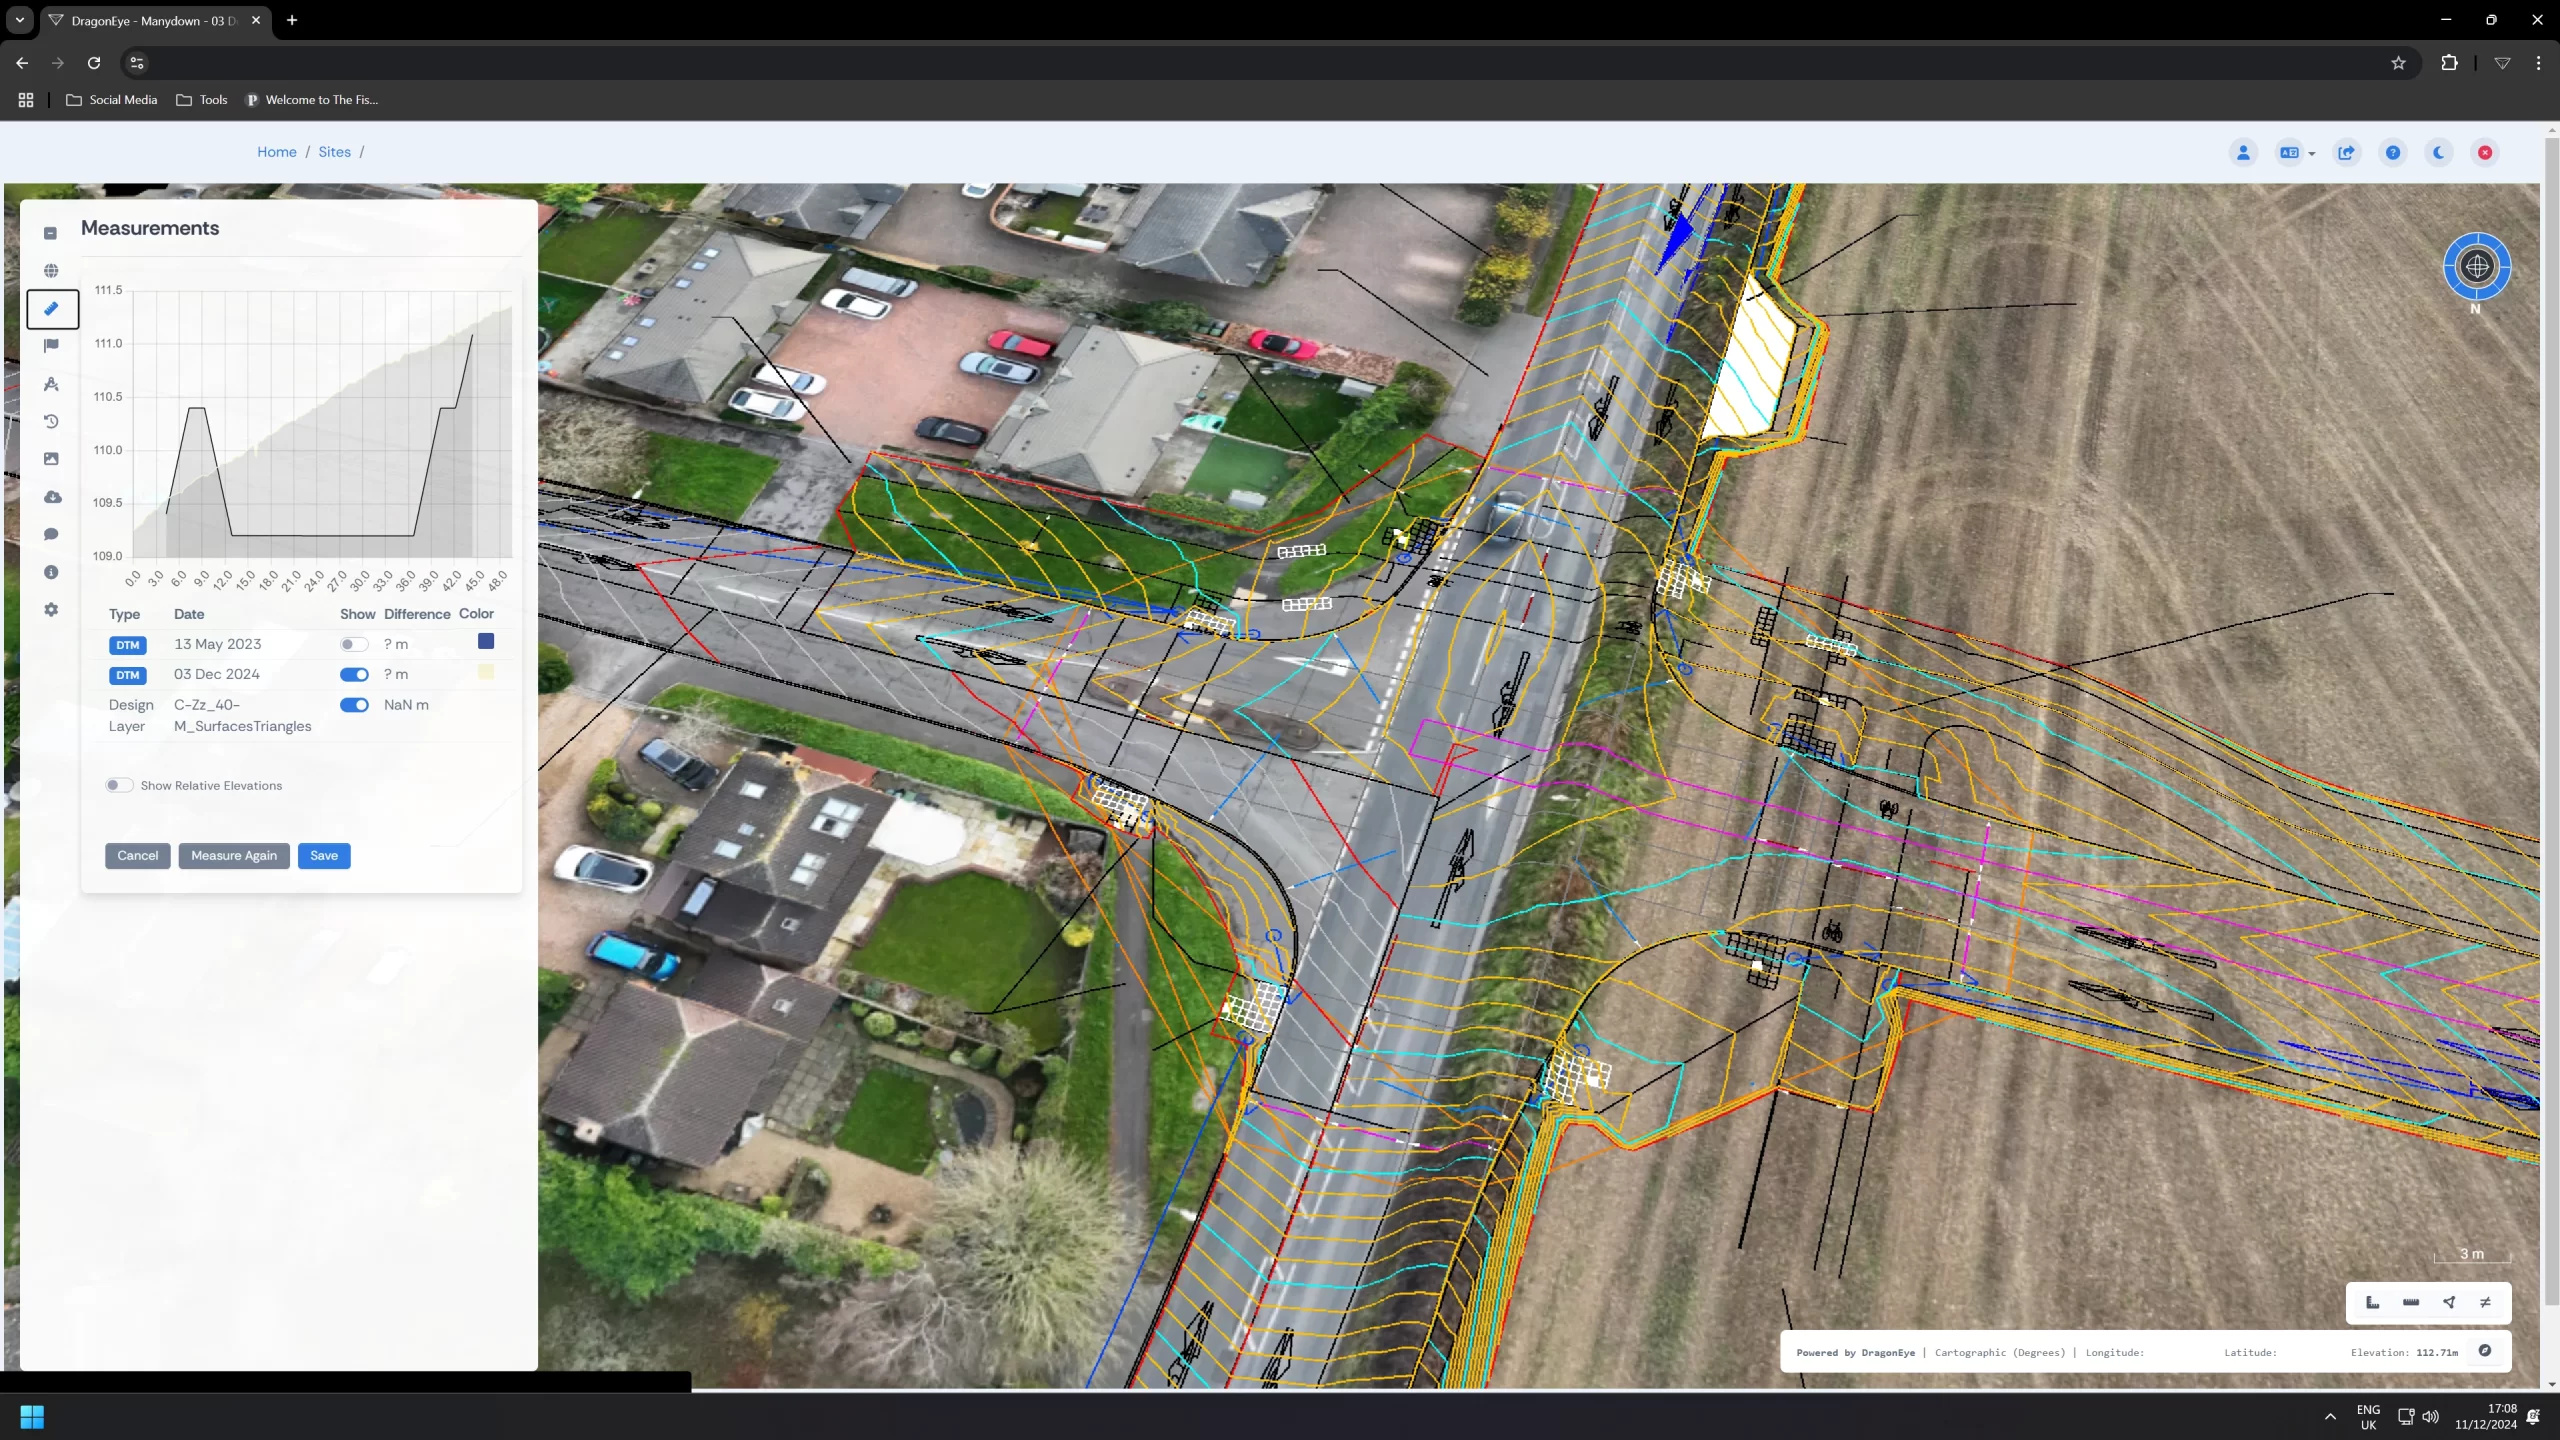
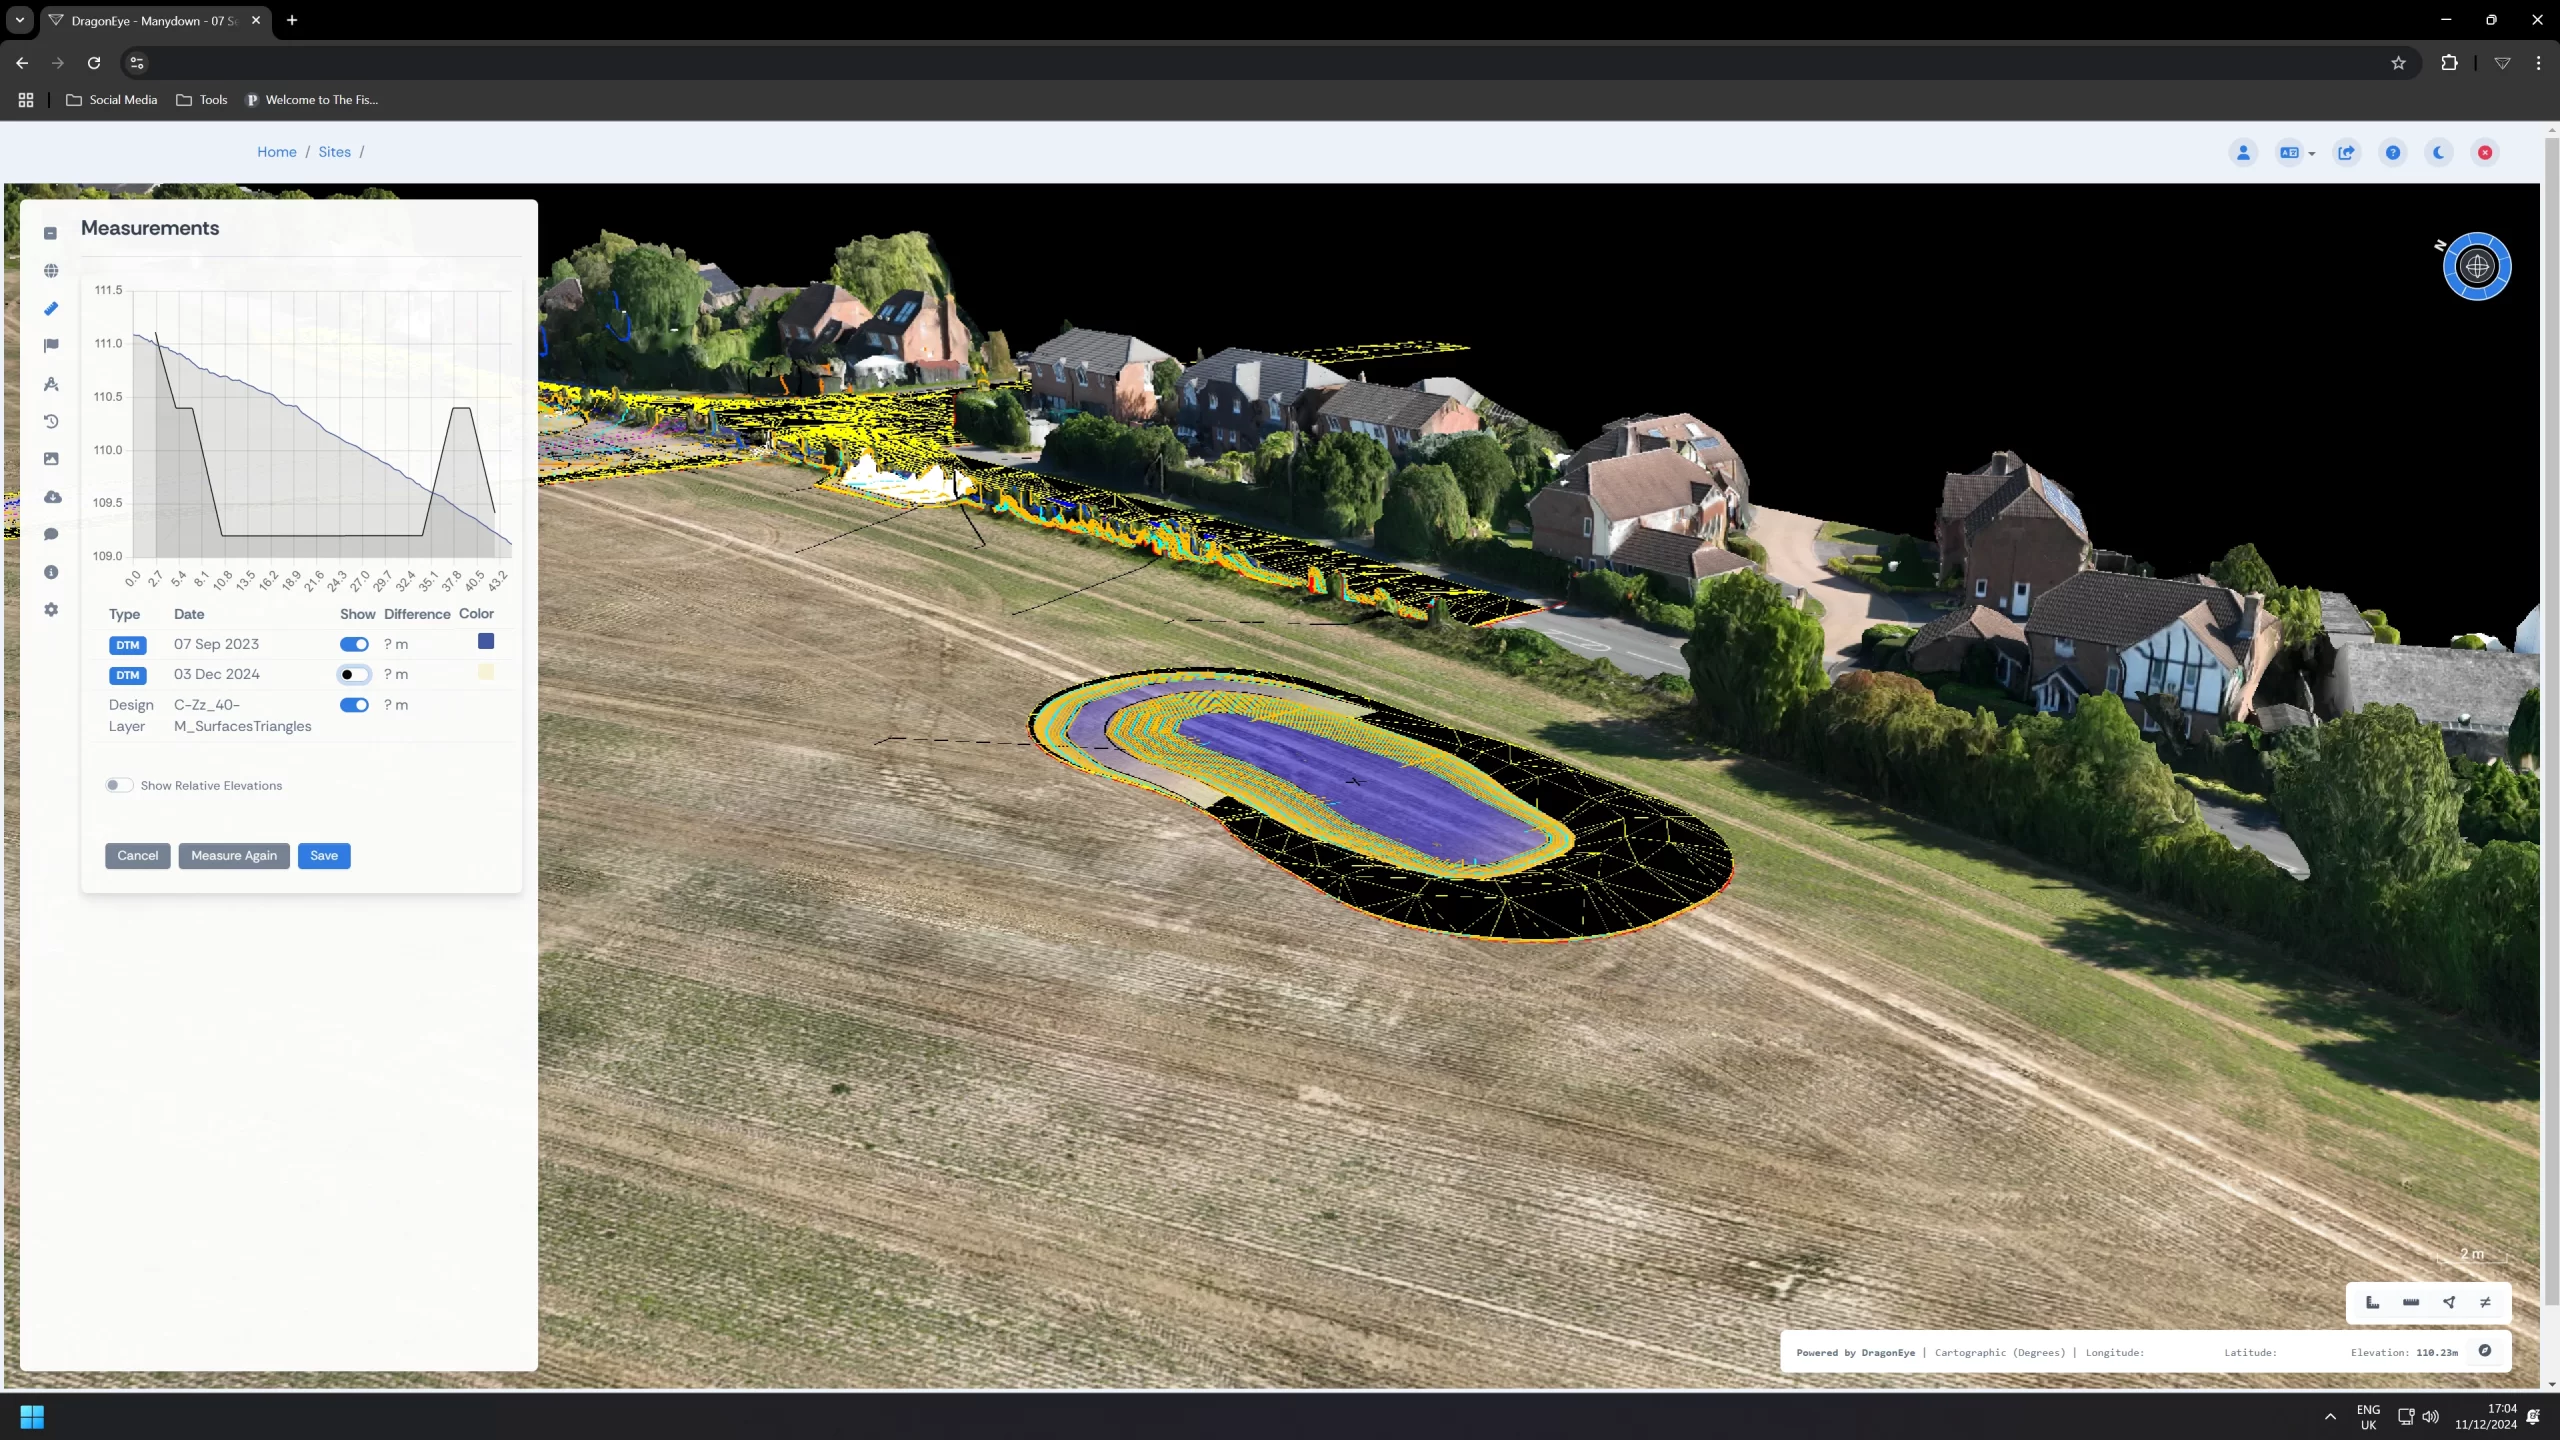
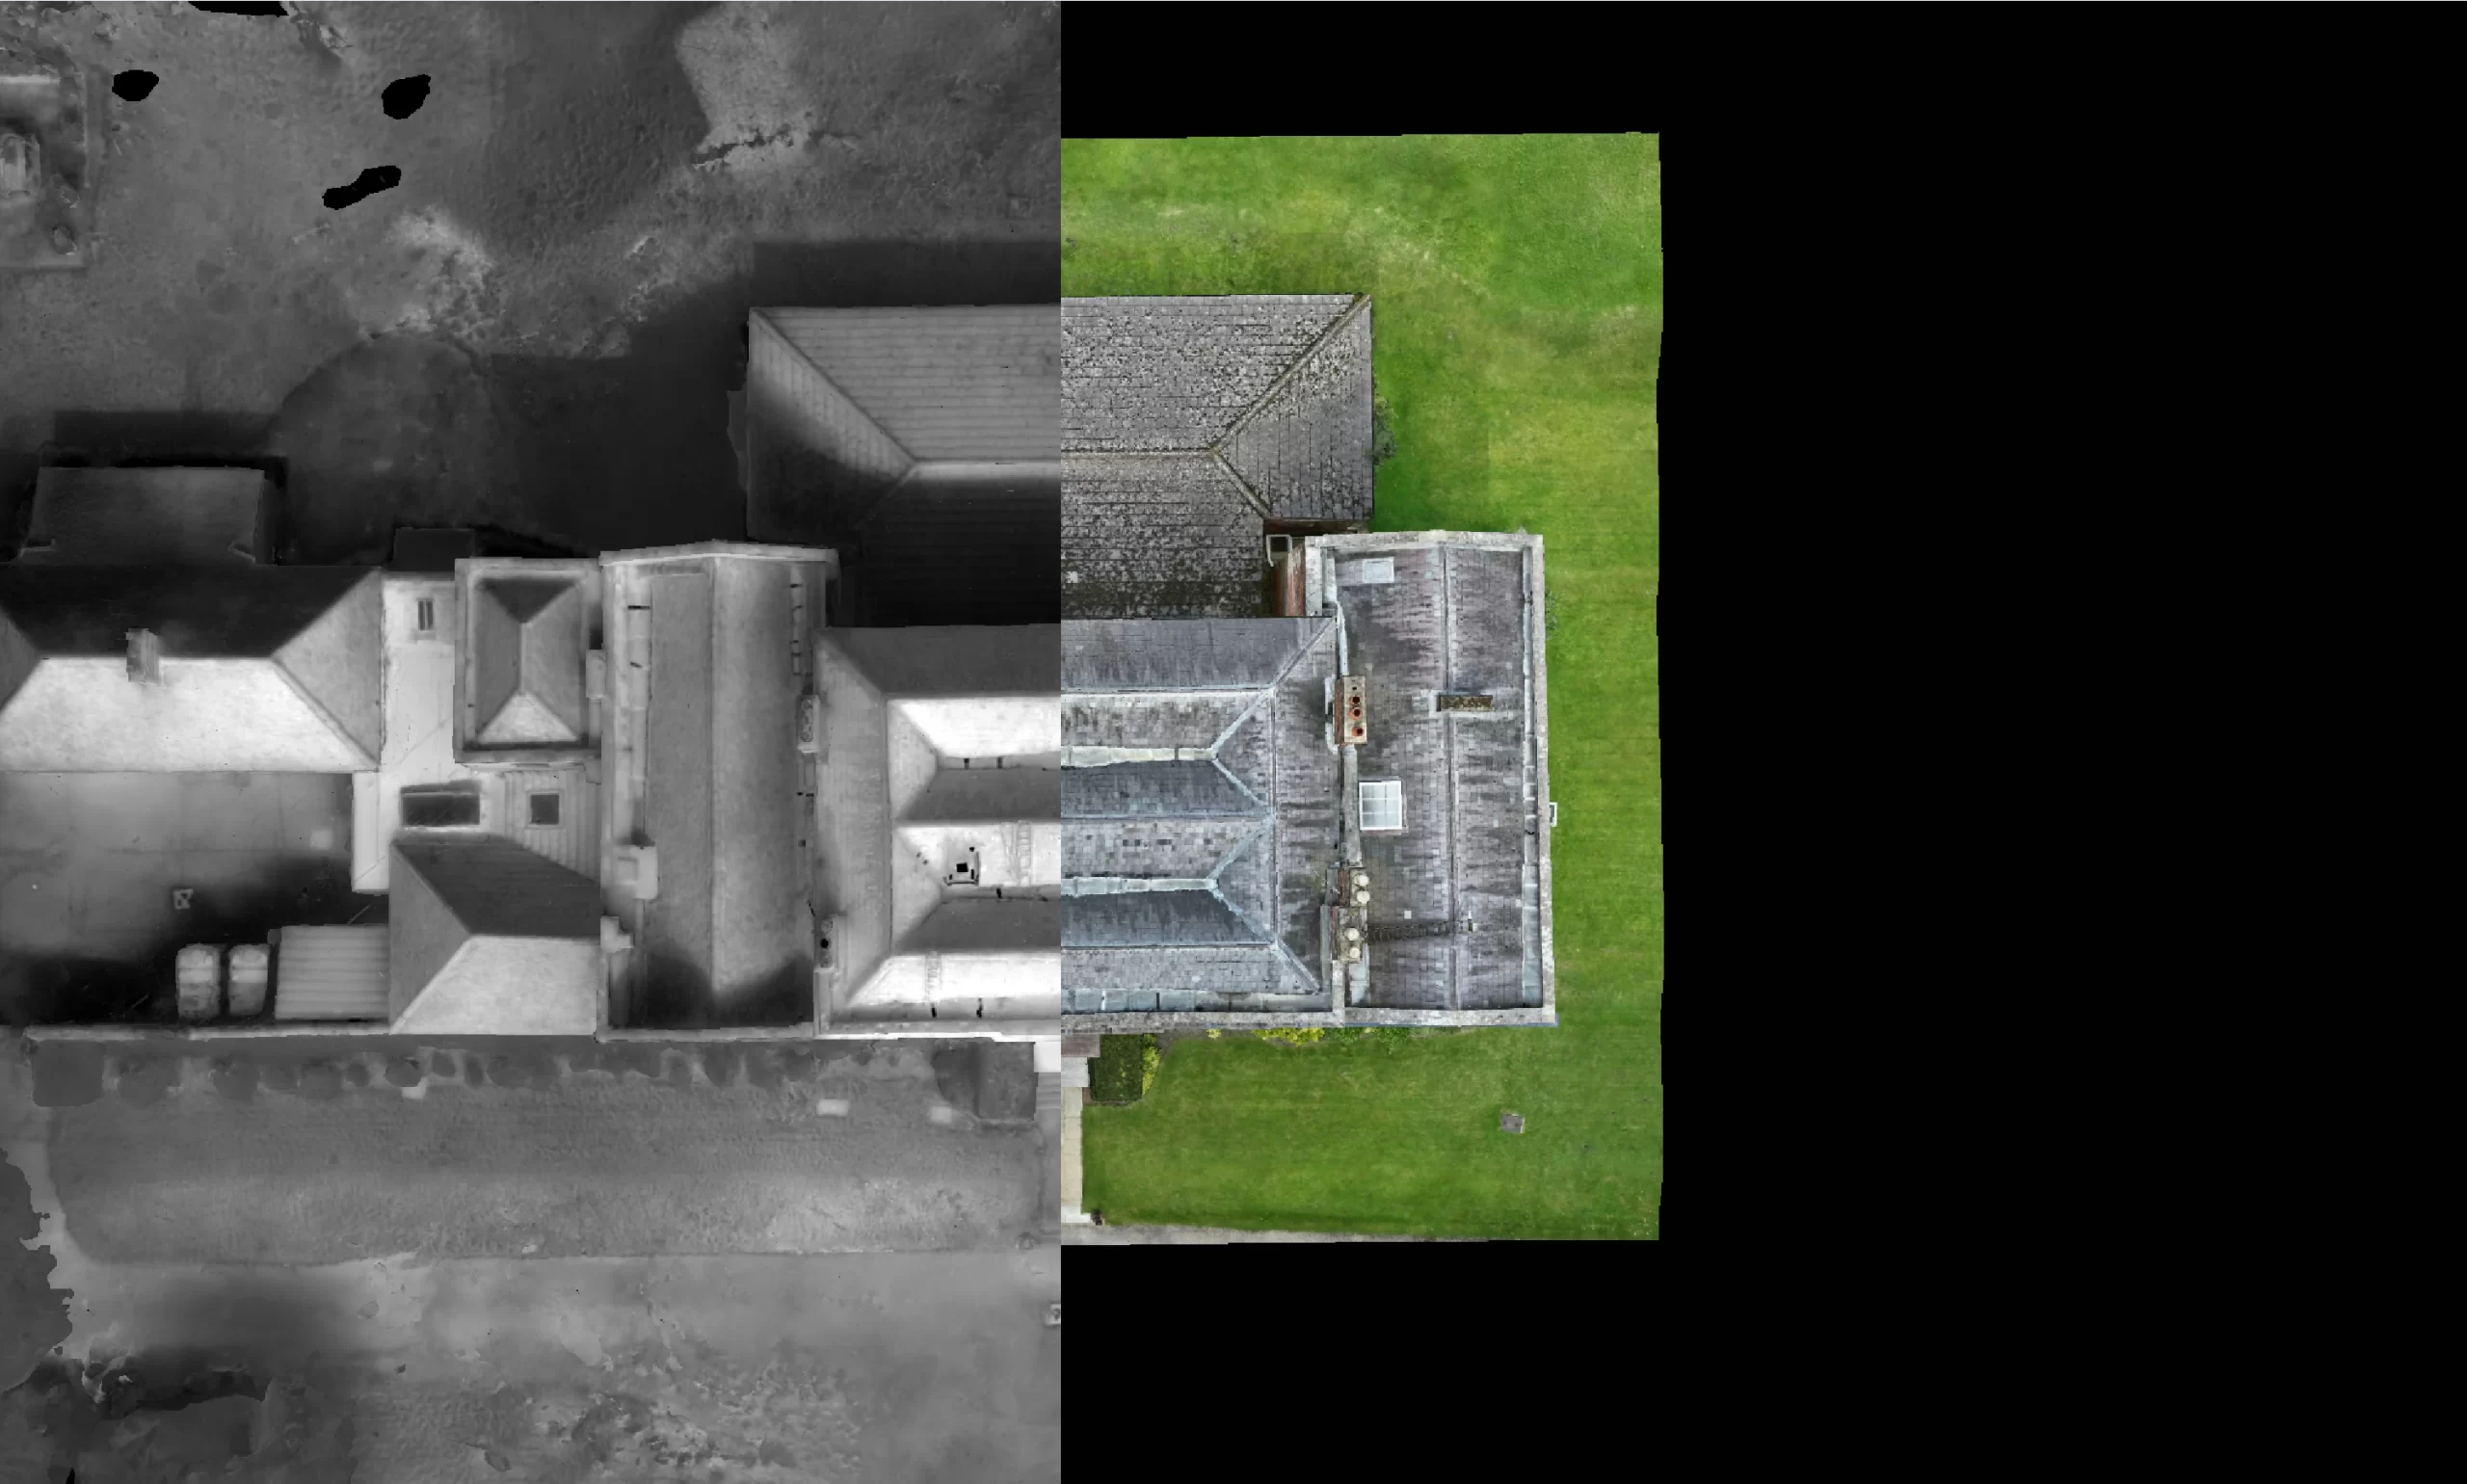
By comparing and contrasting different data sets and visualisations, you gain deeper insights, greater control, and improved confidence in every decision. Explore your project from multiple perspectives to ensure the highest standards of accuracy, efficiency, and innovation.